
Mastering Dashboard Design: 6 Key Design Principles for Effective Data Visualization

In collaboration with the Trebellar team, we designed an insights platform to consolidate a building’s disparate sensor data, such as occupancy, air quality, and energy consumption, into actionable insights aimed at enhancing building efficiency, lowering costs and carbon emissions, and improving occupant experience.
As we experimented with various design concepts for this dashboard, which would enable users to swiftly comprehend complex data, spot trends and patterns, and make well-informed decisions, we distilled our findings into six key design principles.

1. Identify User Types and Their Questions
What is the purpose of a dashboard? We defined the purpose of a dashboard as a place to answer user questions. For instance, users might consult a variety of dashboards during a given week to answer questions like “How busy is the cafeteria right now to grab lunch?” or “How is the air quality on Floor 7 to work?” By determining the questions users are likely to ask, we can explore ways to present the data to address those specific inquiries.
To uncover these questions, we first identified our user groups: VPs of Workplace, Facility Managers/Directors and Company Employees. We chose to focus on Facility Managers/Directors as our primary user group for the MVP, as they are the ones who would be using these dashboards frequently to make informed decisions on behalf of the VPs. We then conducted user research to determine the questions they needed help answering.
Key questions included: How are we performing against our carbon footprint goals? How can we minimize energy consumption and costs? Should we renew the lease for the San Francisco Tower this year? Are employees working effectively? With these questions in mind, we began exploring the best ways to visualize the answers, which led to the following design principles.

2. Establish Information Simplicity and Hierarchy
Our dashboard features numerous widgets displaying various types of information, such as carbon footprint, energy consumption, occupancy, air quality, and open issues. In order to prevent information overload and still make the dashboard glanceable, it was crucial to determine which information should be shown in the summary view (the dashboard) versus the detail view. We considered different concepts, such as excluding graphs from the summary to make them easier to consume or offering small, medium, and large widgets with varying information density levels. For the detail view, we also explored different filter types, visualizations, and the potential need for a list view.
Ultimately, we decided on a single default size for dashboard widgets that includes a summary number for a specific time period and a simple graph illustrating data changes over time. The big number gives a summary and the graph presents changes over time. We believe this layout gives just the right level of information to the users before they might decide to drill down to learn more.
We carefully designed the widget layout and data presentation, using visual cues like color, size, and positioning to establish a clear and coherent information hierarchy. We decided to use the color red to draw users’ attention when there’s an anomaly. Users can drill down to access an interactive detail page, where they can adjust time periods, interact with the graph, and view data in a table format for further exploration.

3. Provide Context and Comparison
Merely presenting users with raw numbers, such as 1200 kW of energy consumption, offers limited value, as users may struggle to determine whether the number signifies a positive or negative change. When displaying data, it is essential to provide useful context, such as:
Industry Benchmarks: Showing data from a similarly sized building in the same zip code
Comparisons: Comparisons to specific time periods, like the previous period or the same time last year
Internal Goals: Allowing users to set their own internal goals
This information enables users to evaluate their current performance, identify seasonal trends, detect potential inefficiencies, and pinpoint areas for improvement, ultimately creating a more valuable and actionable dashboard.

4. Present Actionable Insights
Users consult data to answer questions like “How can I reduce our energy bill?”, “How can we decrease our carbon emissions?”, and “Should we renew our lease?”. However, it is challenging to answer these types of questions by merely examining raw numbers; users need to draw their conclusions or develop hypotheses.
To simplify this process, we included “insights” in addition to data visualizations. We identified several types of insights:
Unusual observations: These represent anomalies or atypical events, such as spikes or drops. Only this type of insight is displayed on the dashboard’s summary view, as it is the most critical for users to see at a glance. Other insights are provided on the detail page.
Trends: These are typical occurrences in the data, reflecting expected changes due to past events or seasonality.
Predictions: Using machine learning (ML), we make projections based on historical data, such as forecasting for the upcoming month or estimating when a specific goal will be achieved.
Suggestions: The most valuable yet challenging to generate insight is a suggestion, which is also produced by ML. This type of insight offers actionable recommendations to users based on historical data and future predictions, such as advising on lease renewals or suggesting actions to reduce costs or carbon emissions.
By presenting these insights alongside the data, we make it more efficient for the users to take informed actions.
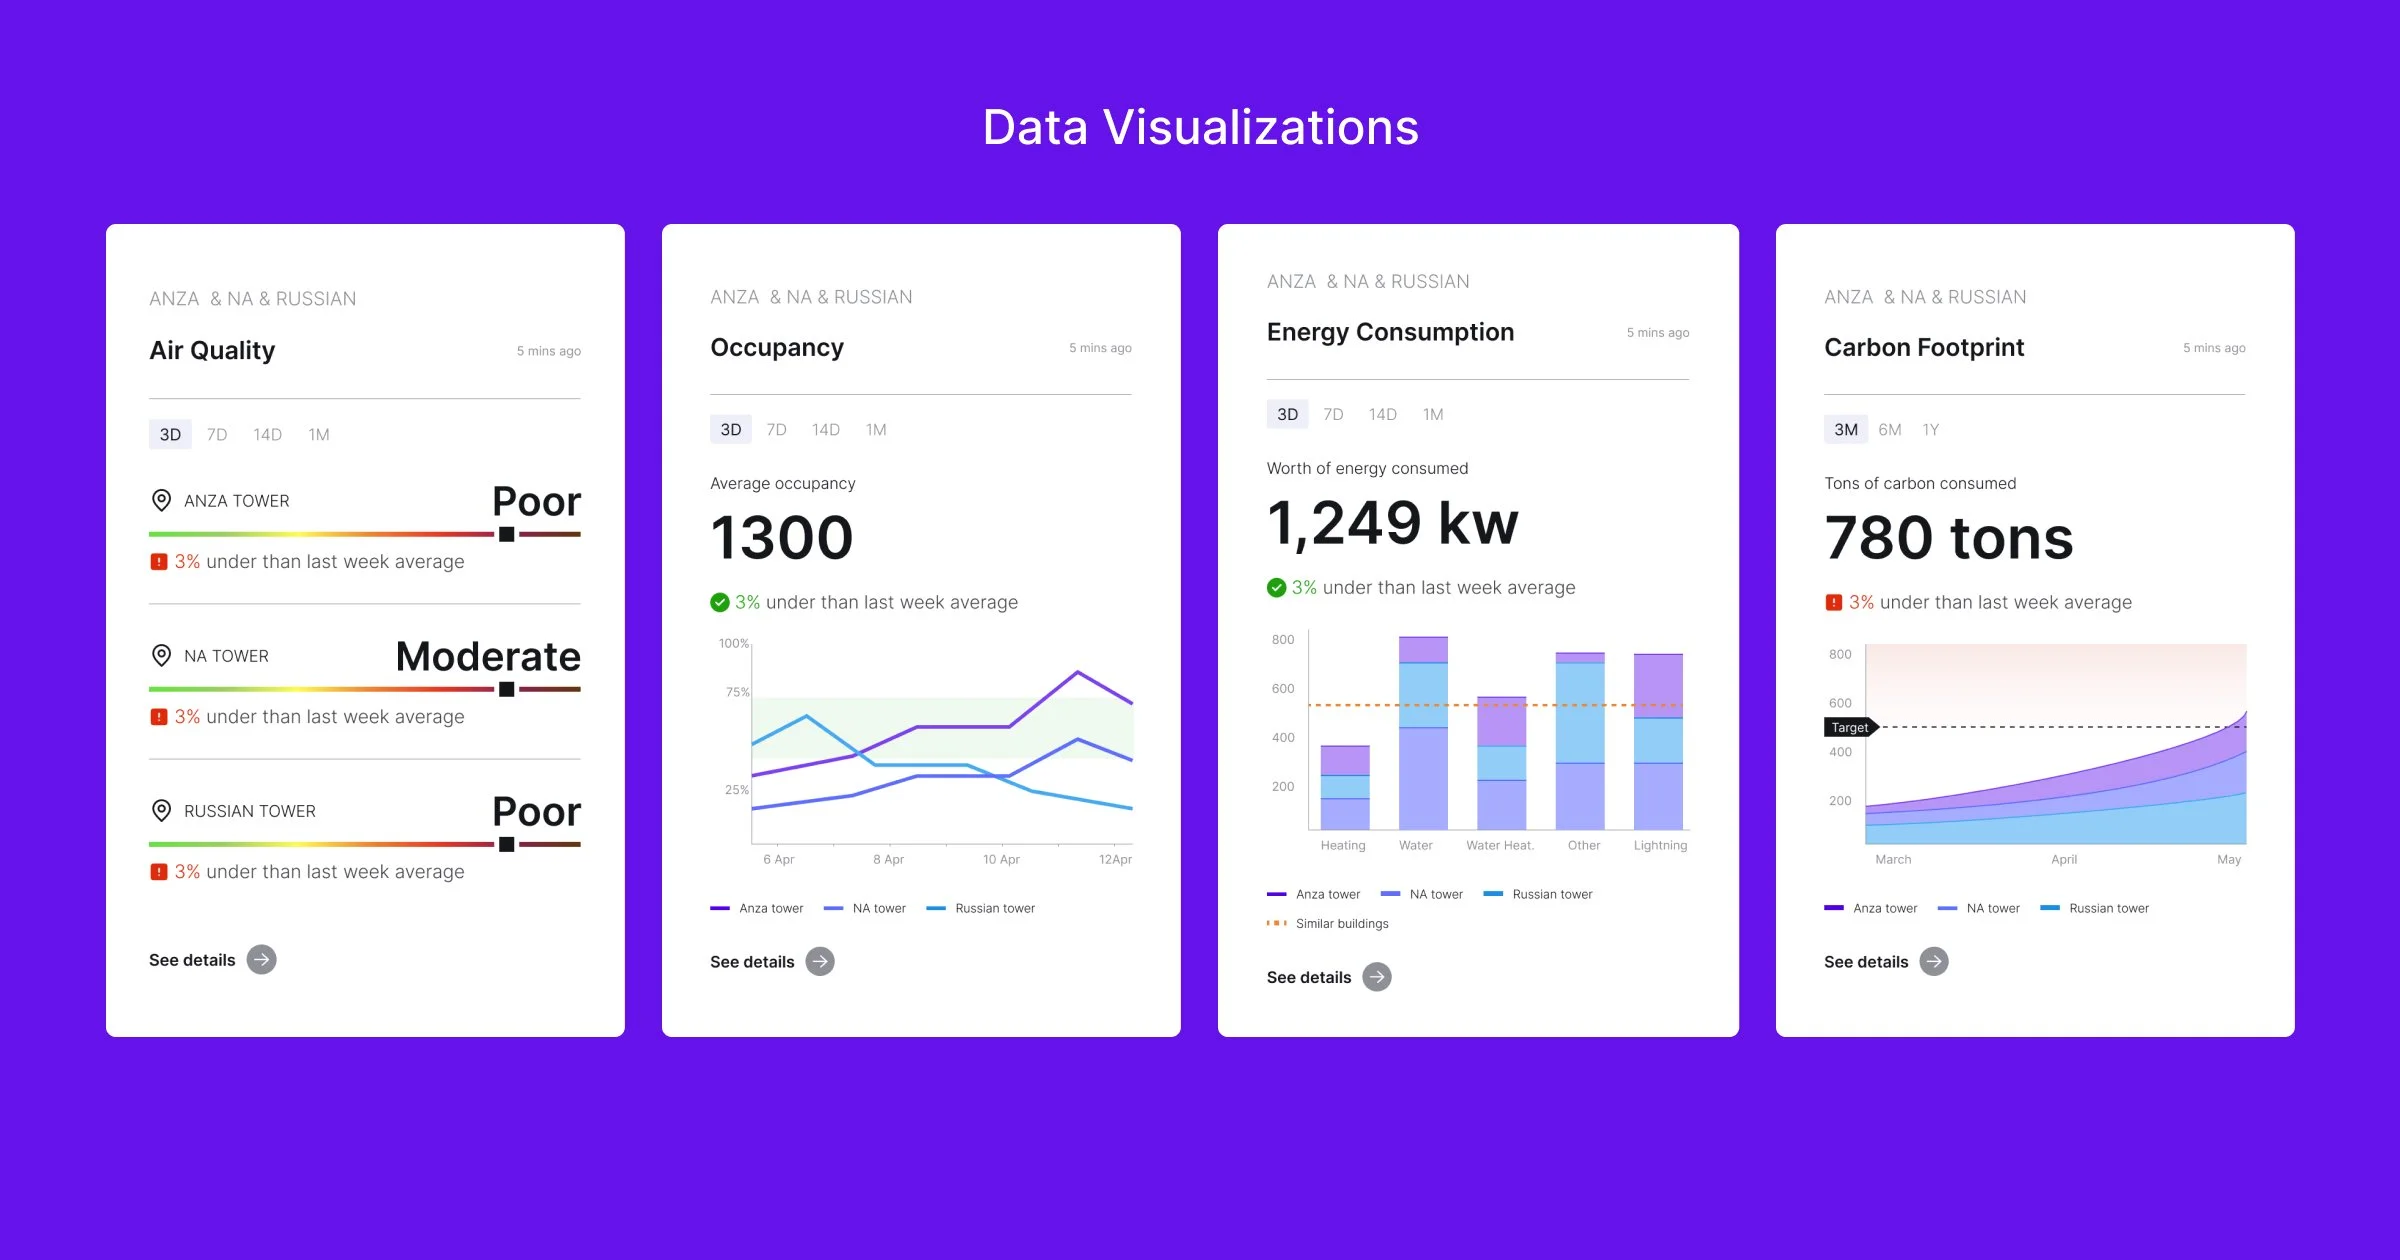
5. Pick the Right Visualization and Create Visual Diversity
Choosing the appropriate visualization for the information you want to present is crucial. Line charts are best suited for displaying minor data variations over time, bar charts for illustrating larger data variations and comparisons over a limited time, and area charts for summarizing relationships between datasets and demonstrating how individual data points relate to a whole.
In addition to selecting the right type of graph, our usability testing revealed that incorporating diverse visualizations increases user engagement. Users associate specific visualizations with particular data types (e.g., line charts for occupancy, bar charts for energy consumption, gauges for air quality) to quickly understand the information. Repeatedly using the same graph for different widgets on the dashboard can lead to visual fatigue, causing the information to blend together. It was important to create visual harmony, all visualizations and colors balanced within the dashboard widgets, so there’s no inconsistency in information hierarchy.

6. Utilize AI for More Intuitive Interactions
Incorporating large language models (LLMs) into the product was a vital step in fostering more intuitive interactions. With a focus on addressing user questions, we developed a Slack integration that enables users to ask questions such as “How busy is the cafeteria right now?”, “What’s the air quality like in the Meeting Room on Floor 3?”, and “Which building has the lowest carbon footprint score?”, providing them with immediate responses.
We also added a search function to the product, enabling users to type in questions and either receive direct answers or view the data in a dashboard widget. We are currently exploring ways to allow users to create dashboards, widgets, and workflows through the search box. We aim to test these approaches with users to determine which ones resonate best.
In summary, the implementation of these six design principles has been instrumental in the development of an exceptional data visualization dashboard. By understanding user needs, simplifying information presentation, providing context, delivering actionable insights, utilizing appropriate visualizations, and integrating AI for intuitive interactions, we have created a user-centric solution that empowers decision-makers to optimize building efficiency, reduce costs and carbon emissions, and enhance occupant experience.
How do these resonate? Any principle that jumps out? Which one should we drill down more?
Many thanks to Berkan Şahan and Yasemin Temizer for contributing to this article.