Improve the efficiency, sustainability of buildings and the well-being of the people inside them.

ABOUT
By harnessing disparate data sets across your company, Trebellar provides actionable insights to enable smart decisions, optimize operations, and reduce carbon footprint. Their mission is to accelerate carbon reduction by improving the efficiency and sustainability of company operations. From the workplace to the workforce and beyond. They are enablers of mass carbon reduction globally.
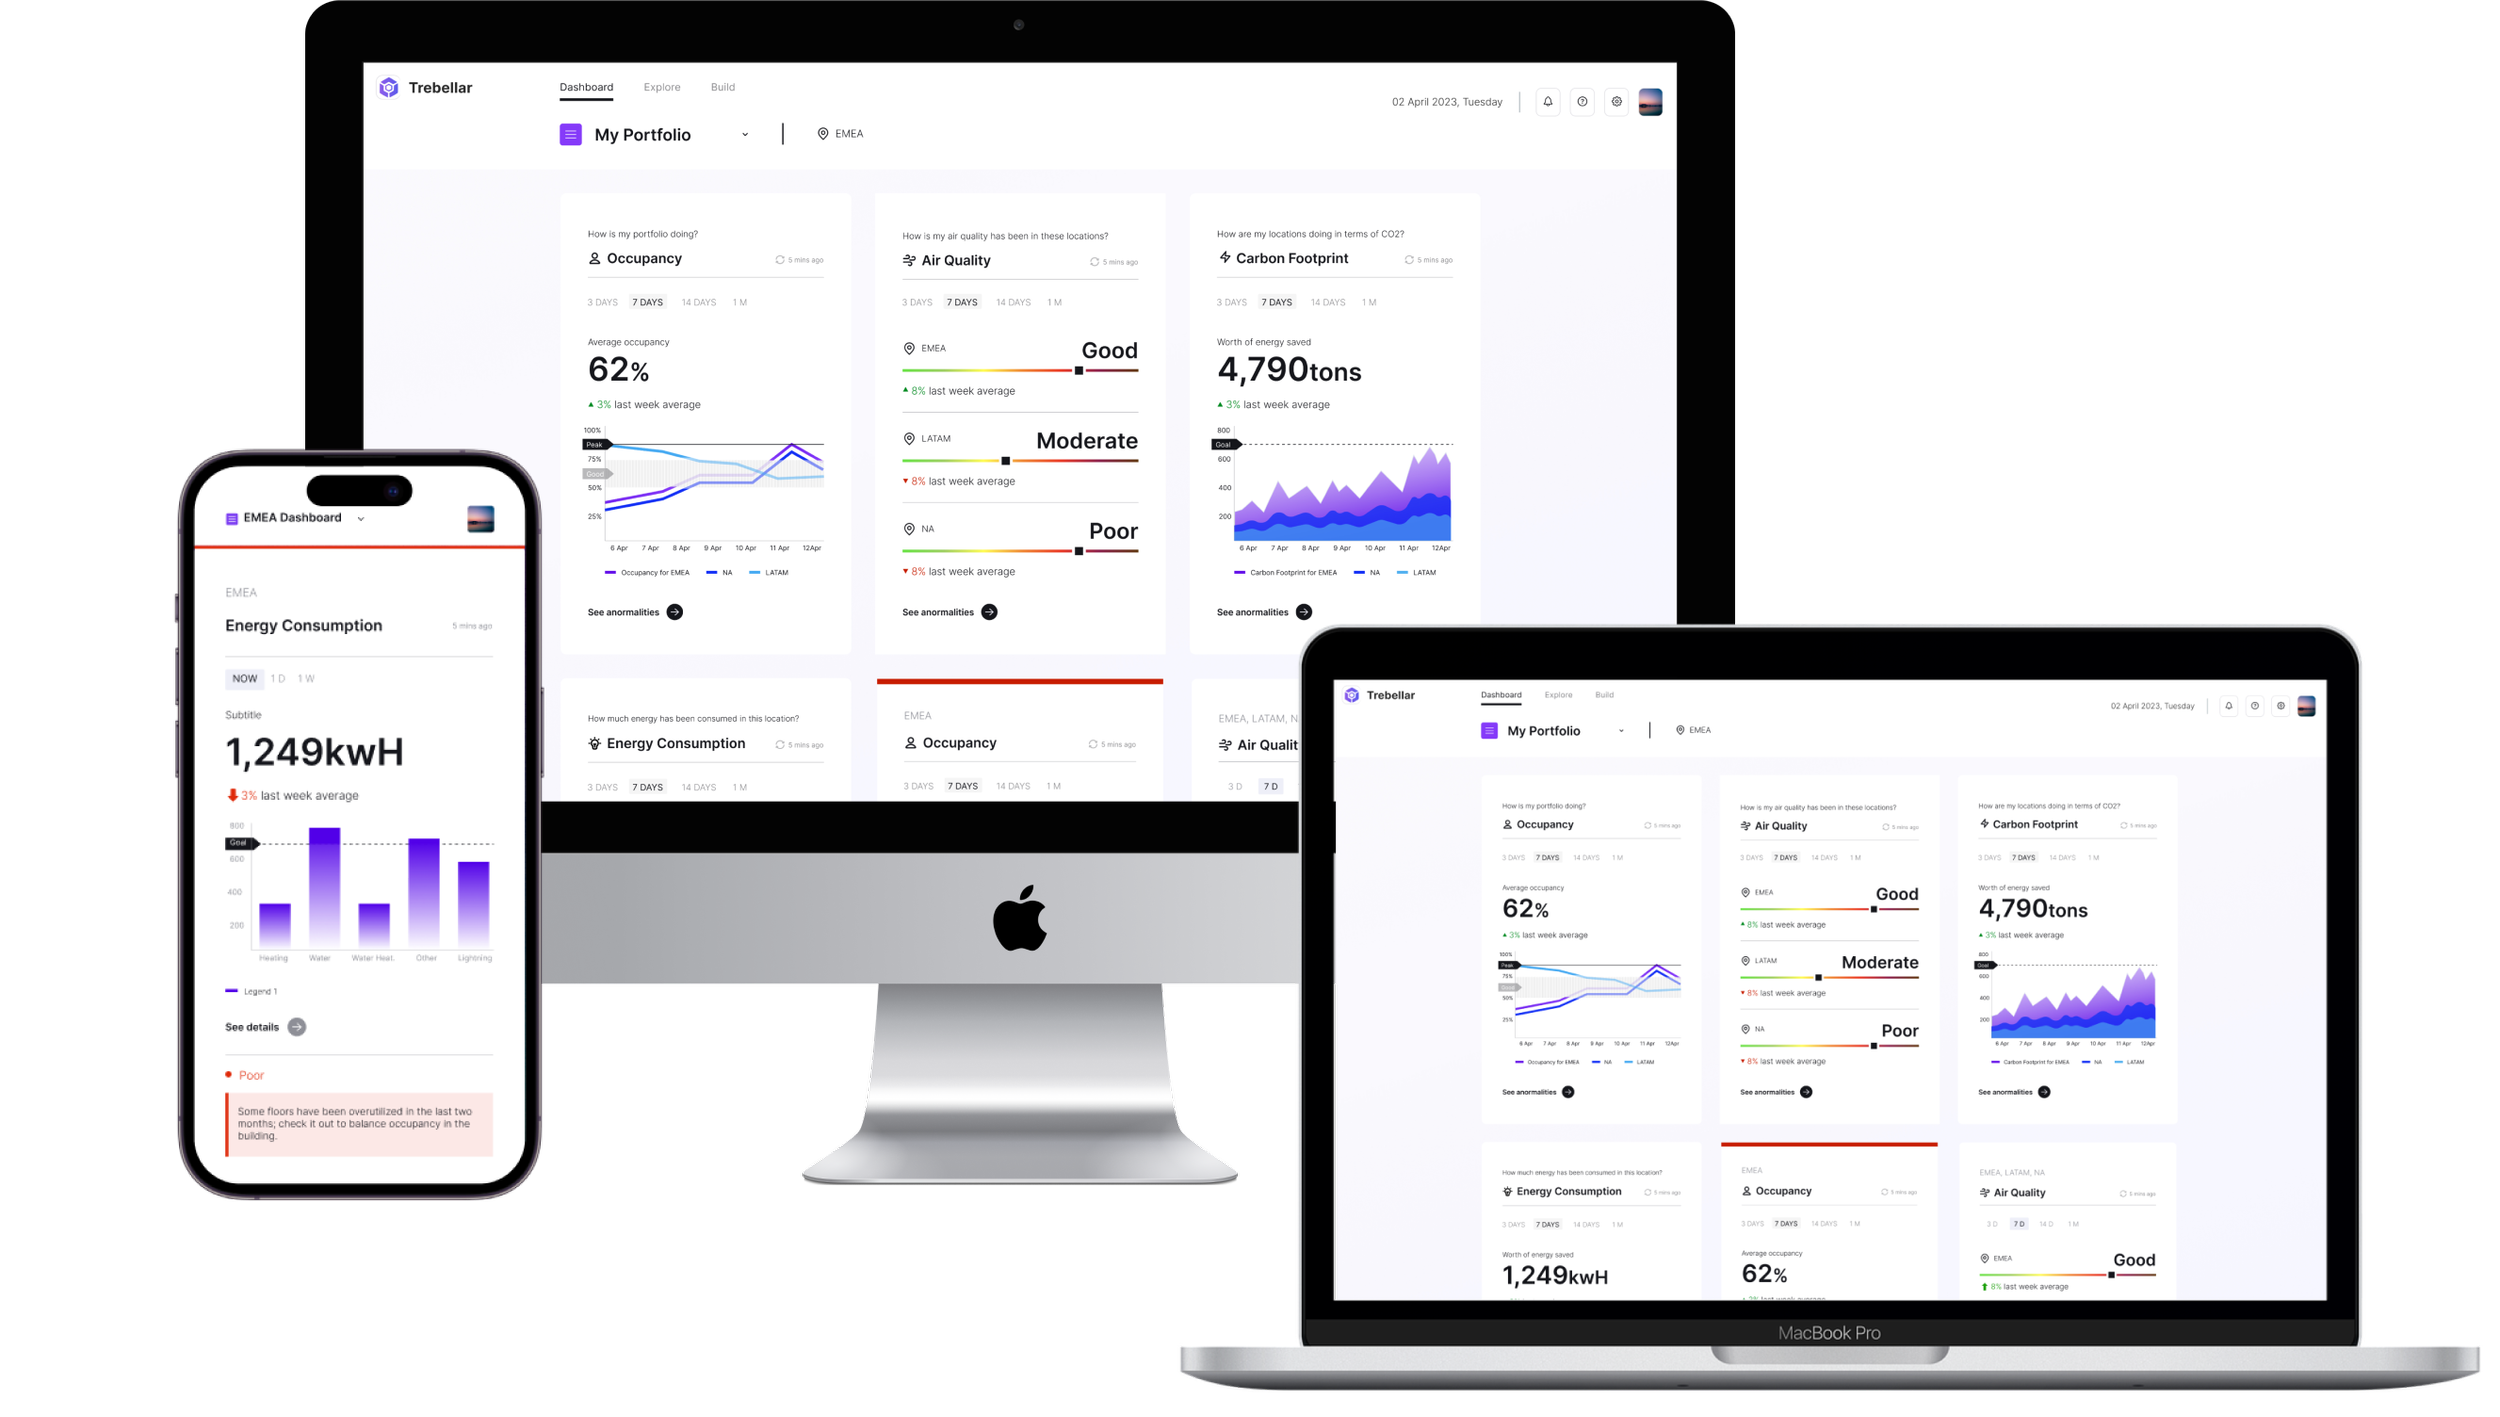
Our collaboration with the Trebellar team involved designing their responsive web product, with a particular emphasis on their data visualization dashboards and drill-down detail pages. We began by running workshops in the strategy phase, where we defined our target personas, their needs, and framed the opportunity. During the design phase, we conducted multiple rounds of user research to gather feedback and make informed design decisions. We ran an agile and highly collaborative process, where the Trebellar team started building the designs as we created them. This approach ensured that the final product met the needs of the users and provided a seamless experience while also being technically feasible.
Data Visualization, Product design, UI/UX Design, Responsive Web
Created by
Studio Pinto
Client
Trebellar
Year
2022-2023
CHALLENGES AND GOALS
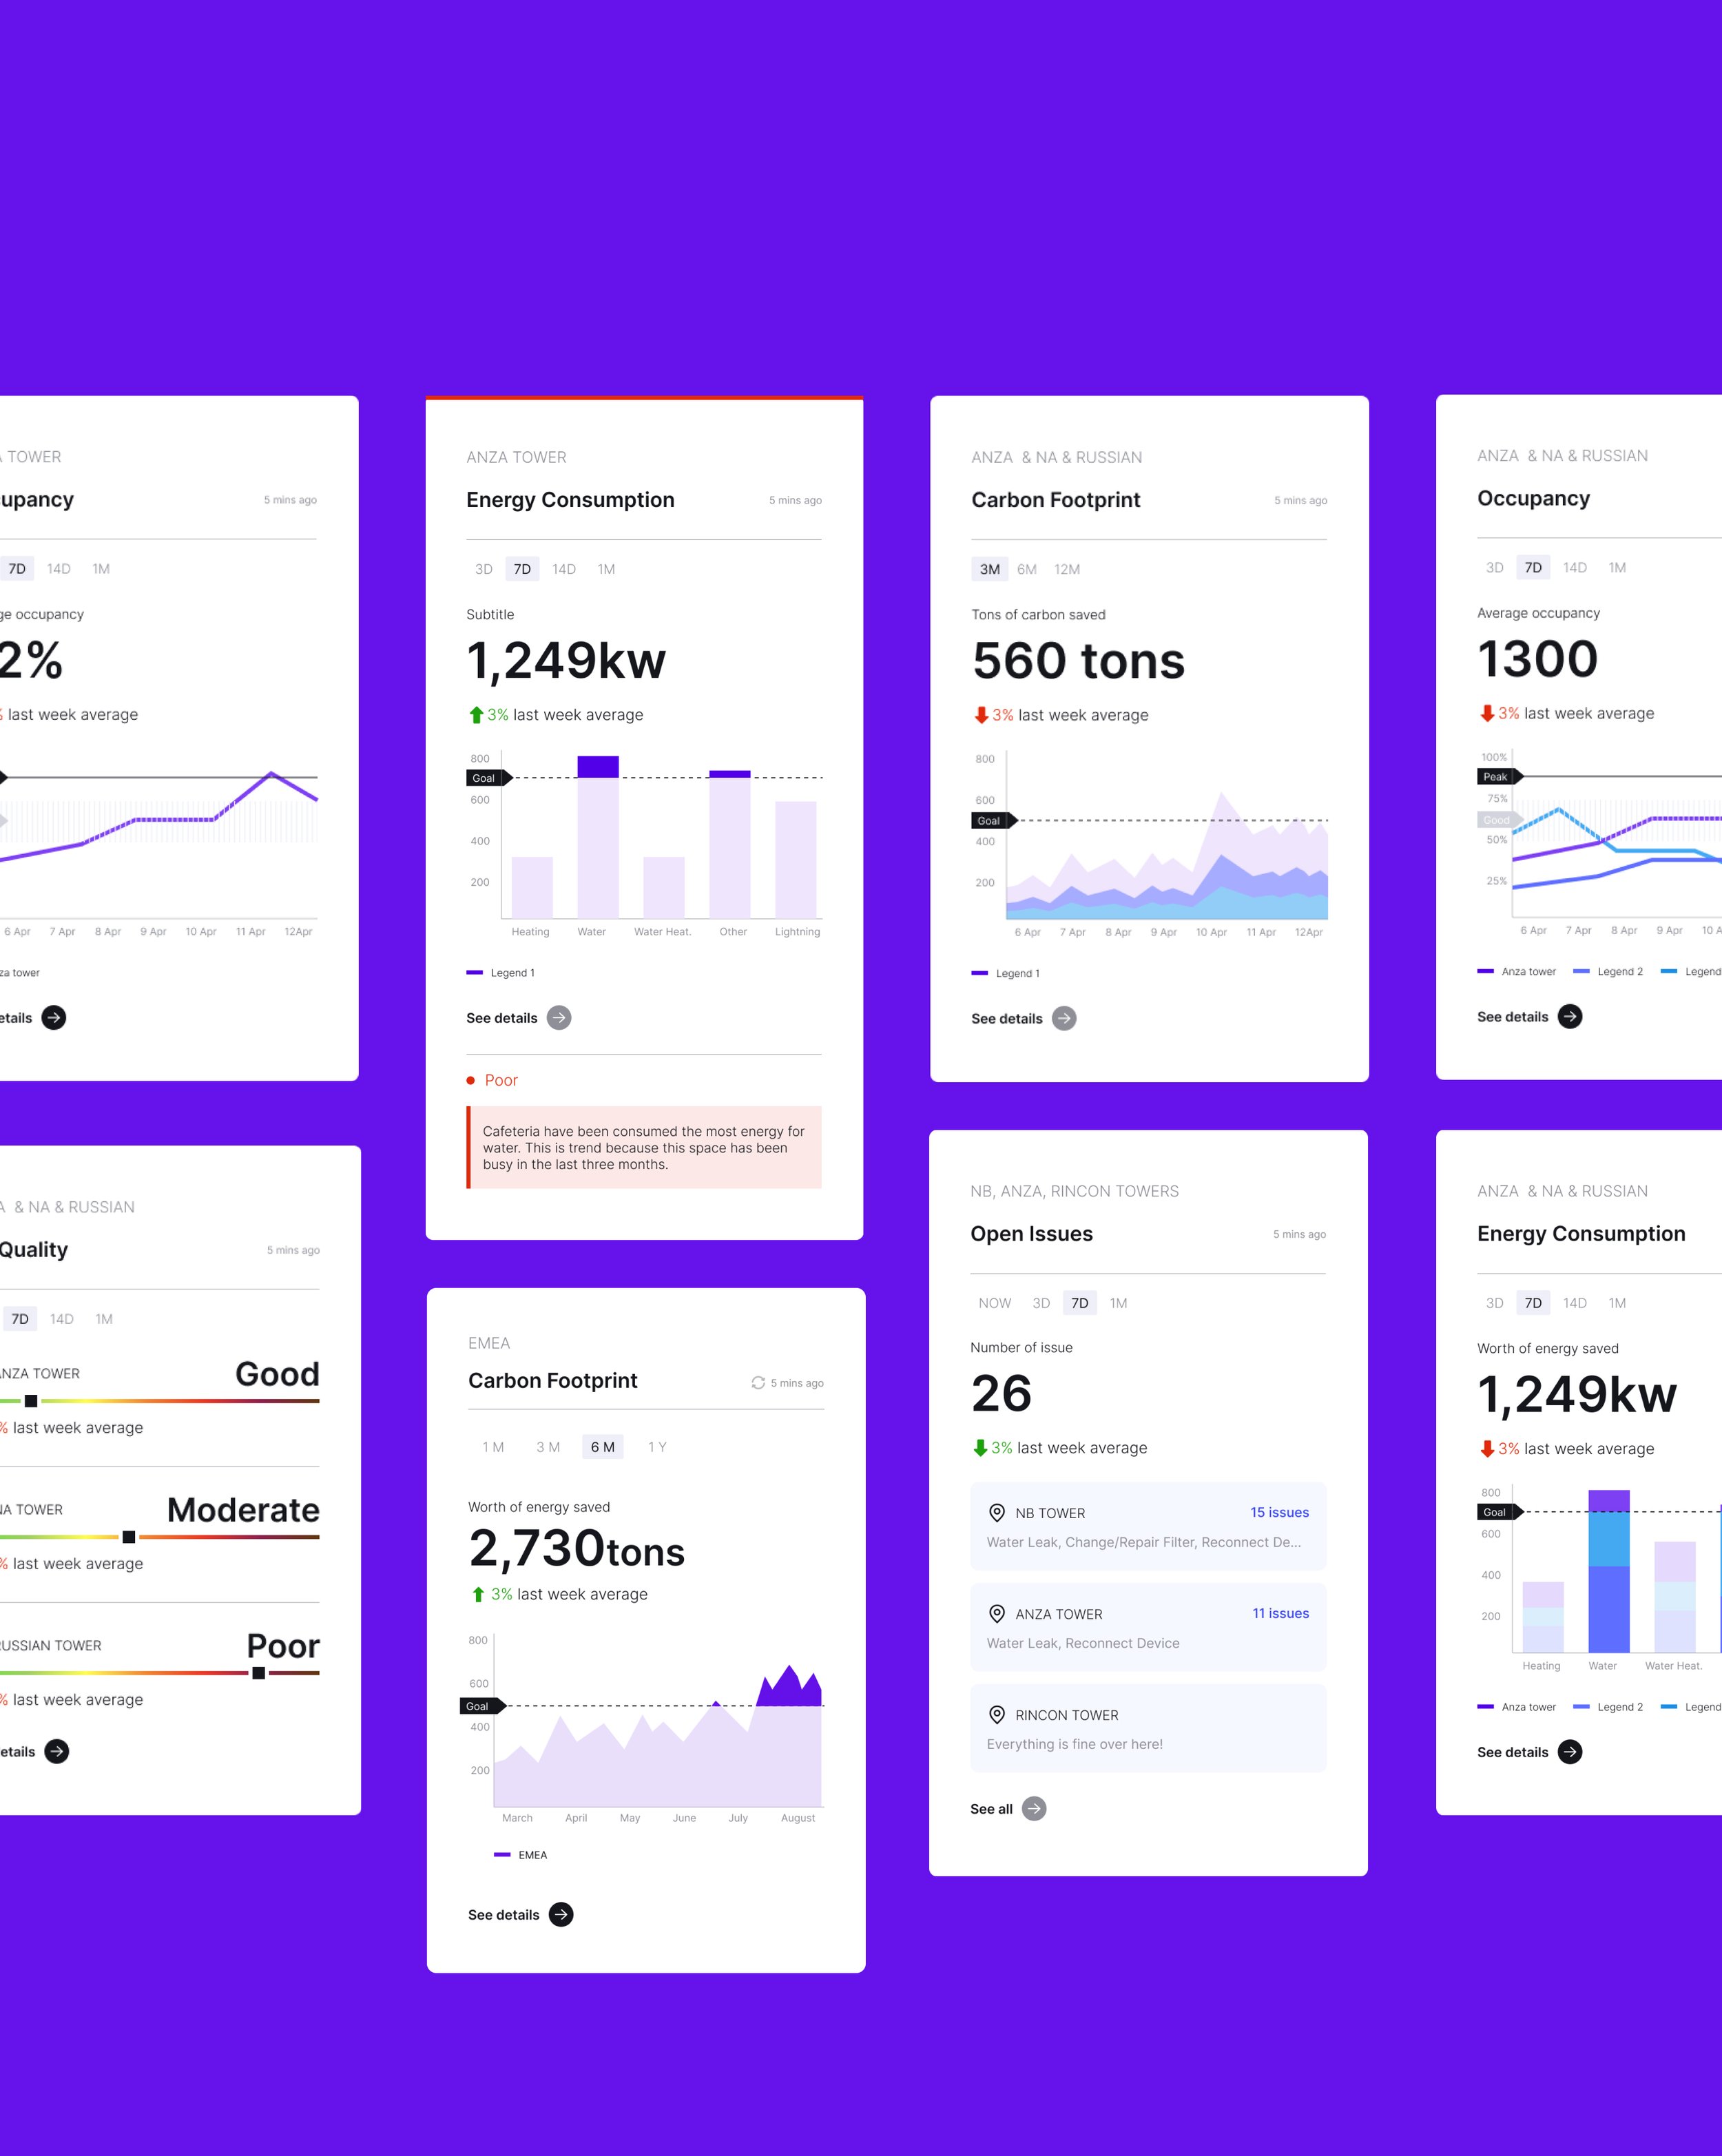
Pay attention to information density, go from summary to detail
Lead with insights
Make the data useful by showing context and comparison
Create visual design system that could be white labeled
Build trust by showing how the data is collected)

TIMELINE
RESEARCH OUTCOMES
User Problems and Needs
01
Users want to see at a glance information on the dashboard.
02
Users not only want to see data but also meaningful insights, predictions, suggestions.
03
Users want visual diversity in the data visualizations for information not to become repetitive.
04
Users want to quickly see if there’s anything that needs their attention.
05
Users want to drill down to details when there’s an anomaly.
06
Users want to see where they’re at in terms of their goal for carbon footprint and energy consumption.
Target users
Facility managers, who are responsible for multiple buildings, they need to see how their portfolio is doing.
EVP’s, who visit dashboards monthly and need to see whole regions.
WIREFRAMES

VISUAL DESIGN EXPLORATIONS

STYLE GUIDE
Typography


STYLE GUIDE
Color Palette